Project ·
Garden Seed Inventory
A live dashboard for my 377-packet seed collection that tells me what I can plant today in Raleigh's Zone 7b, and which bin it's in, built on a dataset I enriched with AI.
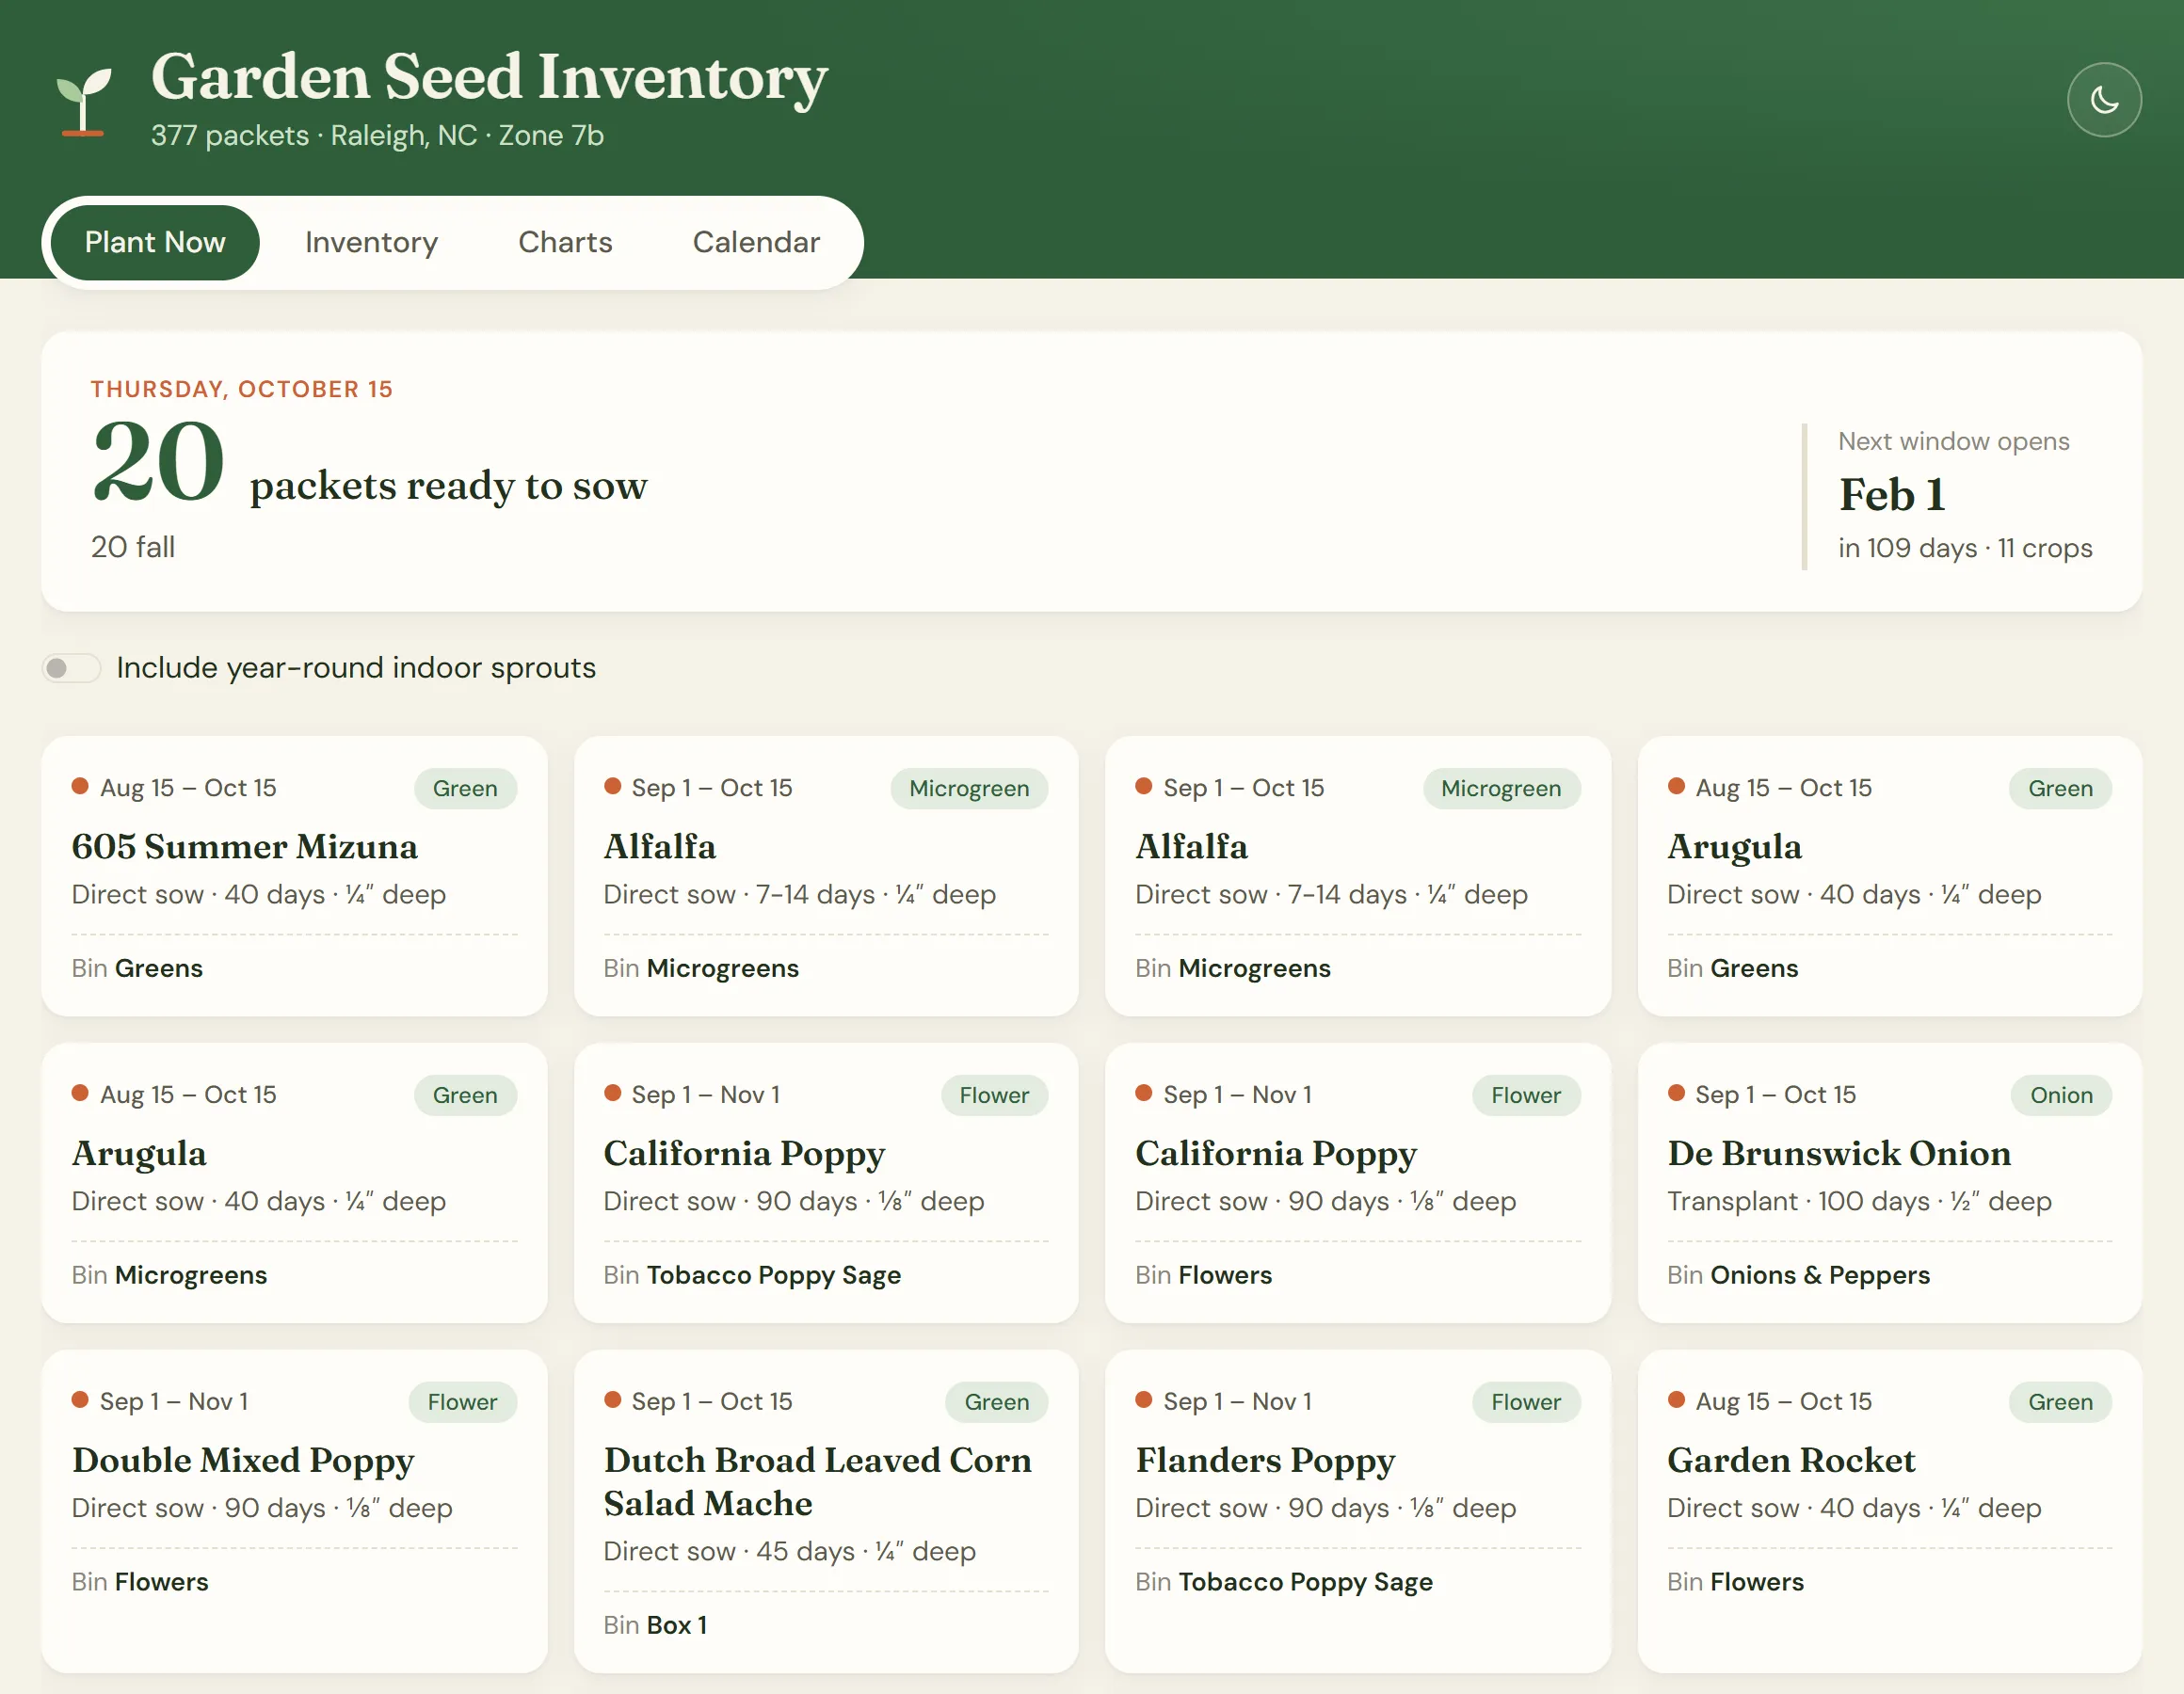
The Plant Now tab on the day I published this. The app runs on Render’s free tier, so if it’s been idle, give it up to a minute to wake up.
The problem
My seed collection had grown to 377 packets: 327 different crops from 9 seed companies, stored across 21 bins. Two things kept going wrong:
- I lost track of what I had. I couldn’t remember whether I owned something, or which bin it was in, without digging through all of them.
- I missed planting windows. Every crop has its own spring and fall window for Raleigh, and there was no easy way to see what should go in the ground this week.
Building the dataset
I catalogued the basics by hand: crop, variety, seed source, and storage bin. Looking up growing details for 377 packets one at a time wasn’t realistic, so I used AI to enrich the inventory. It filled in planting method, days to maturity, spacing, seed depth, season type, and Raleigh-specific spring and fall planting windows. Each row also records a match confidence rating, so I could see how sure the enrichment was about that crop.
The result is a single CSV that drives the whole app. To update the data, I edit the spreadsheet and push, and the site redeploys on its own.
What it does
The dashboard has four tabs:
- Plant Now: every packet whose window includes today (Raleigh time), with sowing method, depth, and the bin to pull it from, plus a countdown to the next window that opens
- Inventory: the full collection, filterable by category, season, planting method, and heirloom status, with text search and a Download CSV button for whatever you’ve filtered
- Charts: the collection broken down by category, seed source, season type, and heirloom vs. hybrid
- Calendar: one row per crop across the year, with spring and fall windows and a line for today
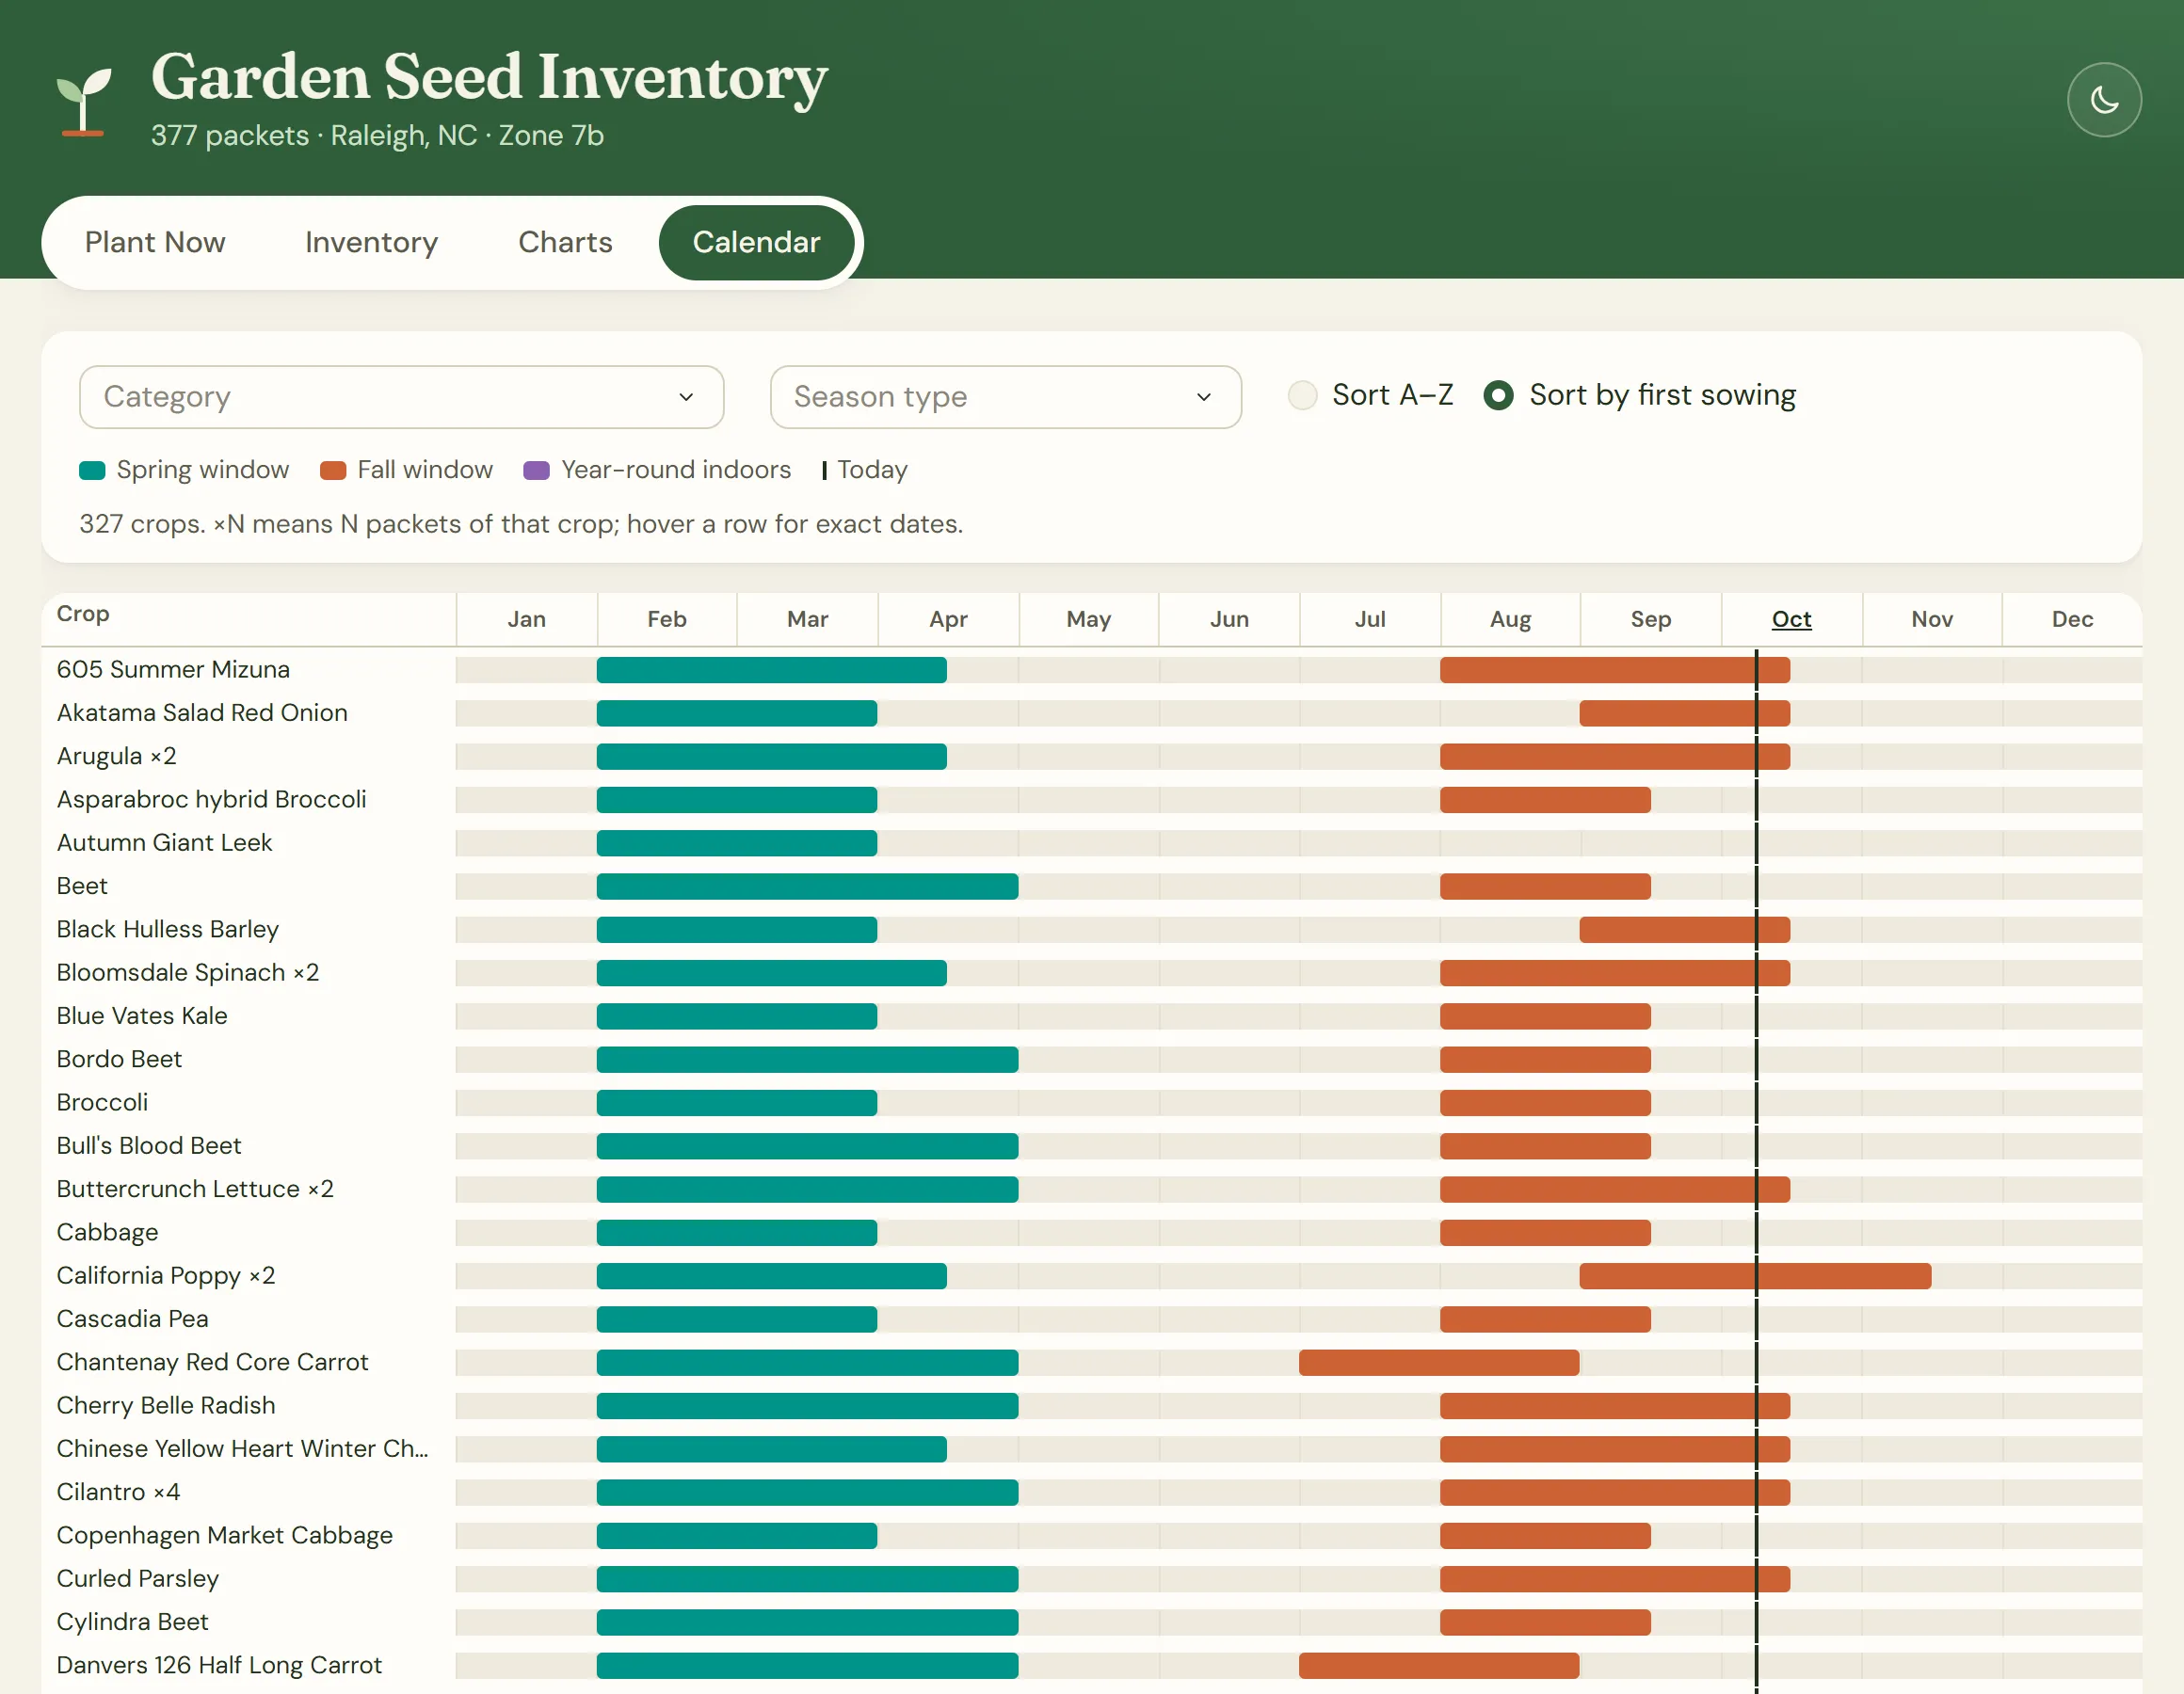
The Calendar tab, sorted by first sowing date. The line marks today.
Turning messy text into dates
The planting windows arrive as text like “Mar 1 - May 1”, so the app parses them into real date ranges. The parser accepts the ways people actually write dates: abbreviated or full month names, hyphens or en dashes, missing spaces, “Year-round indoors”, and “N/A”. It also handles windows that wrap the new year, like “Nov 15 - Feb 1”, so a winter window still counts as open in January.
To keep bad data from slipping through quietly:
- A check script reports the CSV’s structure and lists any window text it couldn’t parse, and it exits with an error so the problem can’t be missed
- The app loads and validates the CSV at startup, so a broken file fails the deploy instead of breaking the page for a visitor
Tested
Automated tests cover the parser’s edge cases: every accepted date format, junk input, inclusive start and end dates, windows that wrap the new year, the half-month calendar slots, and the countdown to the next window. A smoke test loads the real 377-row CSV to confirm every window parses cleanly.
Small details
- Dark mode follows your device setting, remembers your choice, and never flashes the wrong theme on load
- On phones, the filters fold behind a button, so the table and calendar get the screen
- It runs as a single server process with multiple threads, which keeps memory use within Render’s free tier